scRAPID-web - Tutorial
scRAPID-web is a web-based platform offering a user-friendly interface for scRAPID, a computational pipeline for the prediction of protein-RNA interactions from single-cell RNA-sequencing data.
Home page
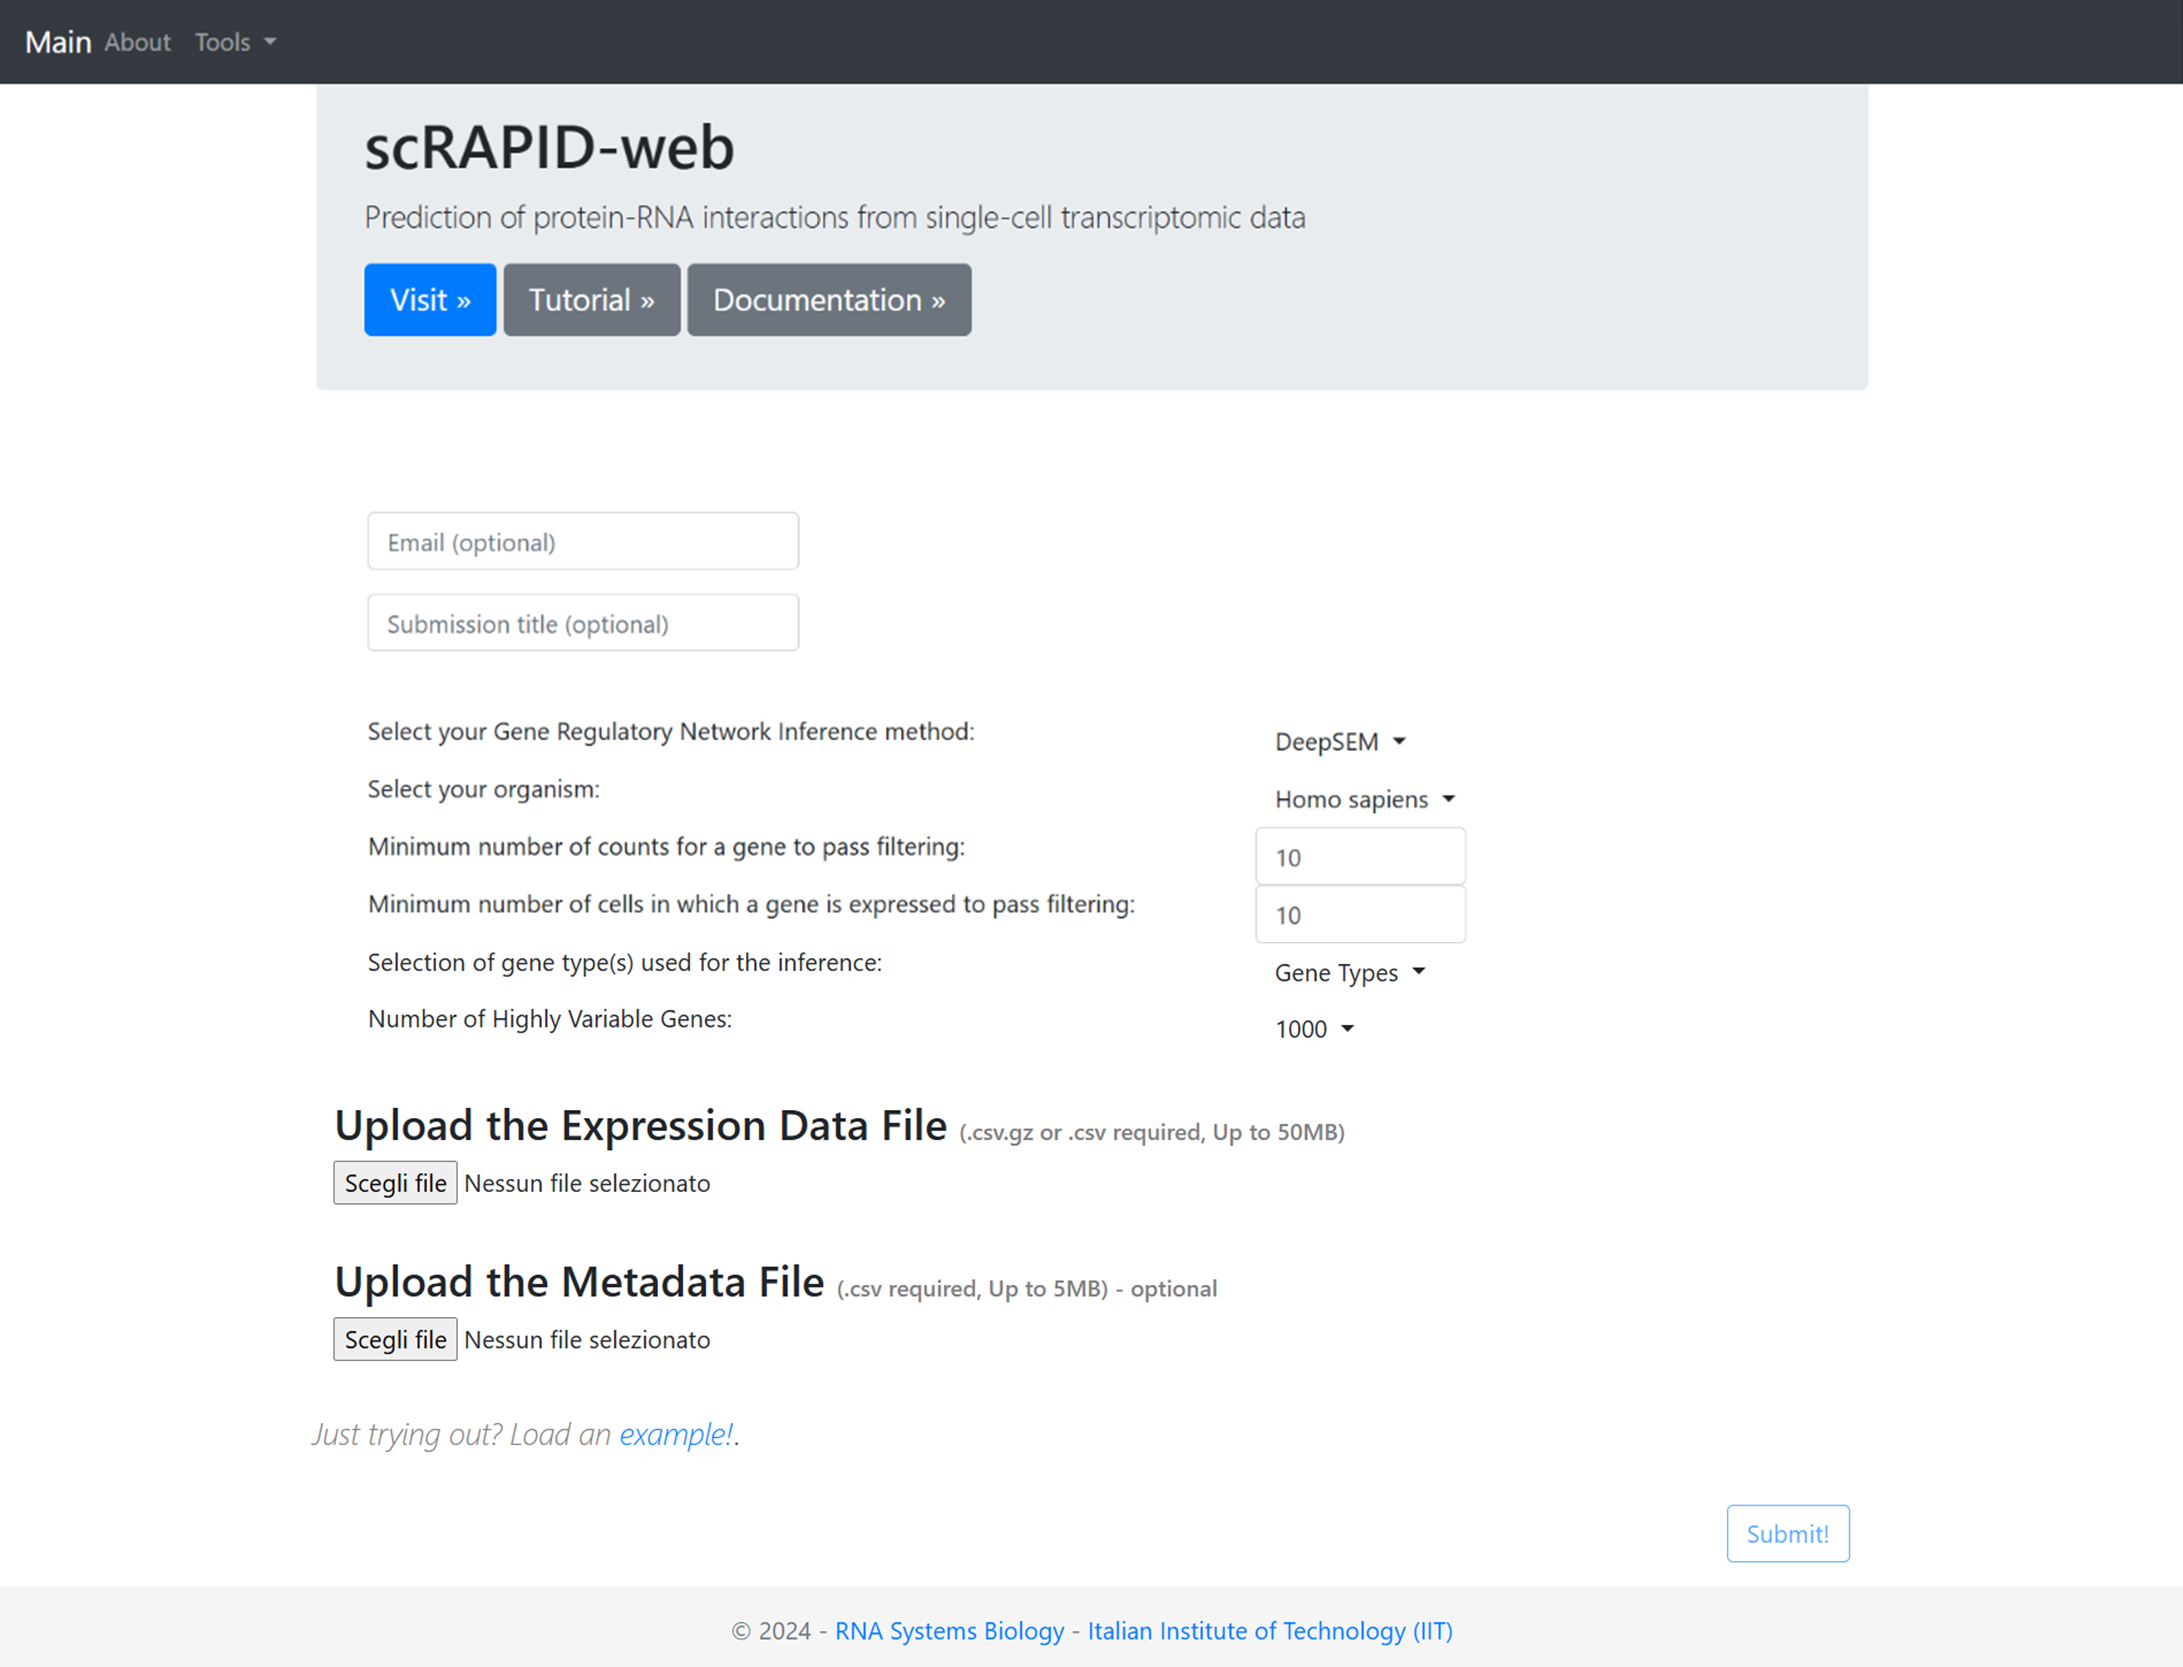
On the web server homepage, users can provide their email and a submission title to receive a notification with a link to the results upon job completion. The user can choose between different options related to the GRN inference algorithm, organism, pre-processing parameters of the dataset and the types of genes to include in the analysis. We describe the available options in detail below.
GRN Inference method
The user can choose between 3 GRN inference algorithms:
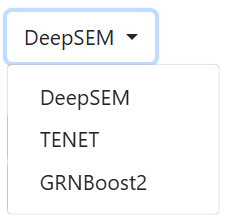
- DeepSEM (default) uses a neural network implementation of the Structural Equation Model to infer the GRN.
- TENET employs transfer entropy to infer directed causal interactions along pseudotime.
- GRNBoost2 is a gradient-boosting regression model. We suggest its usage for the prediction of RBP-RBP interactions, selecting 3000 HVGs.
DeepSEM and TENET are the most accurate algorithms for the prediction of protein-RNA interactions.
Organism
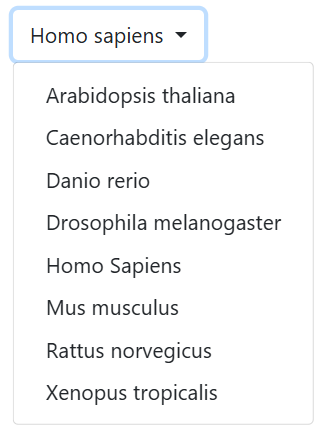
The user can choose among eight different organisms: Arabidopsis Thaliana, Caenorhabditis Elegans, Danio Rerio, Drosophila Melanogaster, Homo Sapiens, Mus Musculus, Rattus Norvegicus, Xenopus Tropicalis. The default organism is Homo Sapiens.
Minimum number of counts for a gene to pass filtering
Those genes whose count values sum up to a value lower than this threshold are filtered out. The user can choose between 10, (add the other value that can be chosen). The default is 10 counts.
Minimum number of cells in which a gene is expressed to pass filtering
Those genes which are expressed (count ≥ 1) in a number of cells lower than this threshold are filtered out. The user has the possibility to choose between 10, (add the other value that can be chosen). The default is 10 cells.
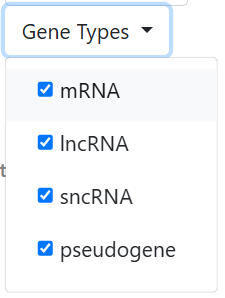
Selection of gene type(s) used for the inference
Selection of the gene type(s) on which the scRAPID pipeline will run. The expression heatmap will be filtered to include only genes belonging to these gene types and those coding for RBPs. It is possible to choose a single category or multiple ones: mRNA, lncRNA, sncRNA, pseudogene. By default all gene types are selected.
Number of Highly Variable Genes
The user can choose between 1000 (default), 2000 or 3000 topHVGs (genes that show significant variability in their expression levels across different cells in the dataset). The list of genes used for the inference is the union of these HVGs with all the highly variable RBPs. Alternatively, by clicking the button "Upload a List Instead", the user can upload a file with a list of IDs, one per row (Acceptable identifiers: Gene Names, Ensembl Transcript/Gene IDs, Alias). This list will be similarly combined with all the highly variable RBPs.

Upload the expression data file
This file contains the gene expression matrix that will be used for the inference. The file should follow a comma-separated format (.csv extension), with genes in rows and cells in columns. Values should represent Unique Molecular Identifier (UMI) or raw read counts. The first row must contain cell identifiers (e.g., barcodes), and the first column should list gene names or gene IDs. In addition to Ensembl Gene IDs, scRAPID-web accepts gene identifiers from various categories, including Gene Name, NCBI gene/Entrezgene accession, NCBI gene/Entrezgene ID, GenBank ID, Xenbase ID and ZFIN ID. These identifiers are automatically mapped to Ensembl Gene IDs during the analysis. Due to the size limit of 200 MB, we recommend uploading files compressed using gzip (.csv.gz extension). For assistance with compression, refer to FreeCodeCamp Guide or CSV Compressor.
Upload the Metadata File
The cell metadata file is mandatory when the TENET algorithm is chosen for GRN inference, while it is optional if GRNBoost2 or DeepSEM are chosen. It should be uploaded in a comma separated (.csv) format, with a size limit of 5 MB. The first row should contain the header. The first column should list cell identifiers corresponding to those in the gene expression matrix. The other columns should represent categorical variables, such as differentiation time points and/or cell types.

After loading the metadata file, the user can choose the column that will be used to filter cells.
After this column is selected, the user will be allowed to select values from this column (all values are selected by default). Only cells corresponding to these values will be used for the analysis.


When the user chooses the TENET algorithm, a second option appears for the metadata, that allows the user to select a metadata column that will be used to colour cells in the diffusion map.
Interpreting the output
After the job is submitted using the “Submit!” button, the result page will be reloaded every six seconds until the results are available.
If the TENET algorithm is chosen by the user, there is an intermediate step before the job is submitted, needed for the computation of the diffusion pseudotime.
A page with an interactive plot of the first two components of a Diffusion map will appear, showing the cells colored according to the categories present in the cell metadata column previously chosen by the user. The user should click on the cell that represents the root for the computation of the diffusion pseudotime. In the example plot below, the metadata categories represent differentiation time points of mouse embryonic stem cells (Semrau, Stefan et al. “Dynamics of lineage commitment revealed by single-cell transcriptomics of differentiating embryonic stem cells.). In this case, the root cell belongs to the "0h" time point (blue cells) and should be chosen as the cell at the edge of the differentiation trajectory, specifically the one with the minimum DC1 value.
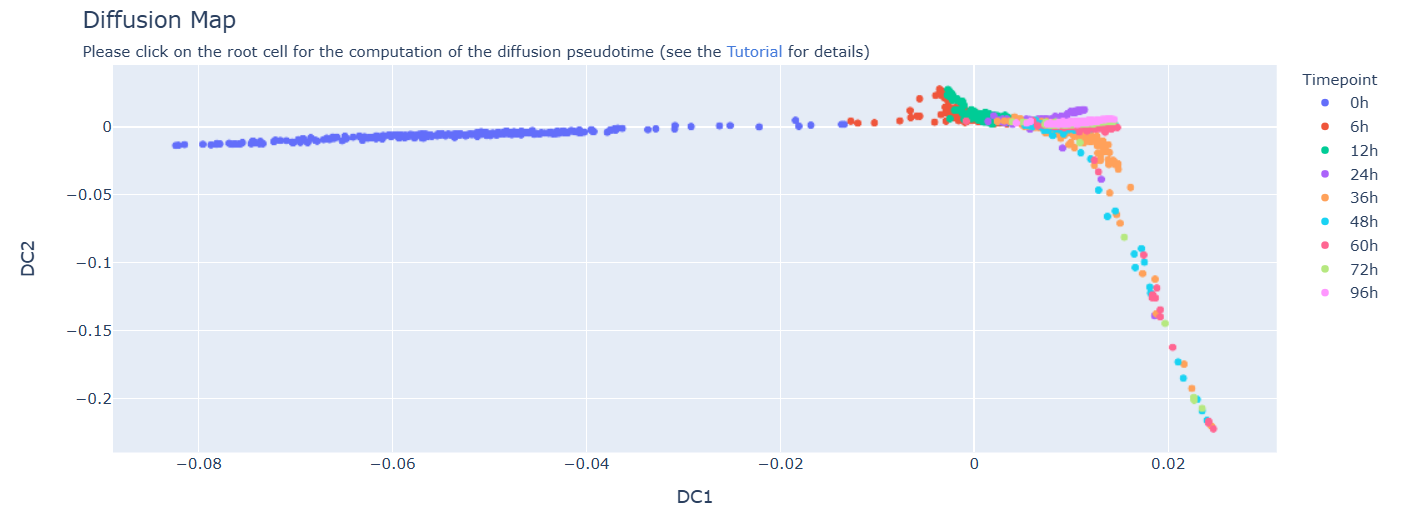
After the selection of the root cell, a pop-up message will ask the user to confirm the selection. If the user does not confirm, the selection can be repeated.
The job is then submitted and the GRN inference is run on the set of genes chosen by the user. All the steps of the scRAPID pipeline (catRAPID-based filtering of the protein-RNA interactions, prediction of hub RBPs and hub RNAs, prediction of RBP-RBP interactions) are performed and the final output page is generated. Upon completion, the final output page is generated, featuring a network visualization at the top and a series of detailed tables below, which are described in the following sections. The network and the RBP-RBP interaction table are not generated when TENET is used.
It is strongly advised to save the results for future reference since they will remain on the server for two weeks.
RBP-RBP interaction network
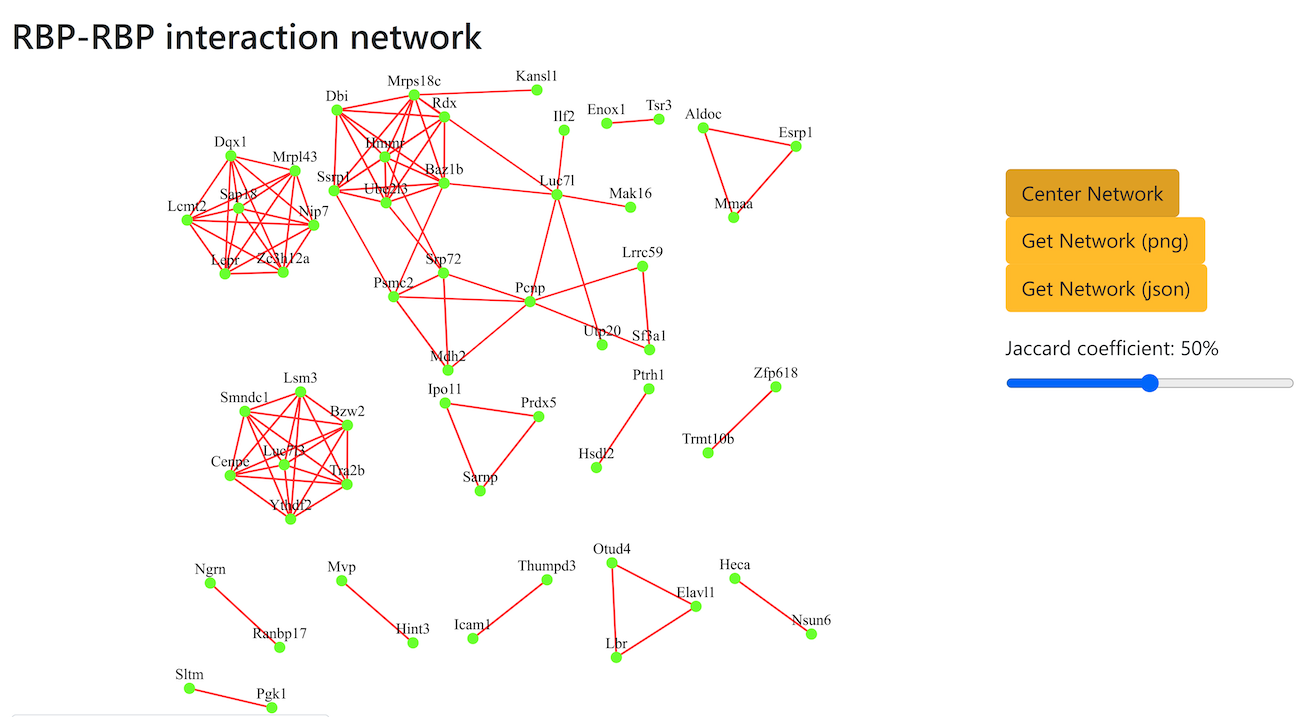
The network shows the interactions between RBPs inferred based on their predicted shared targets. Users can interact with the network by clicking and dragging nodes or zooming in on specific areas. Connectivity can be adjusted by modifying the Jaccard coefficient threshold, enabling the identification of potential protein complexes. Additionally, the network can be downloaded as a PNG image or a Cytoscape-compatible JSON file. Please reload the page if the network is not displayed.
Result tables
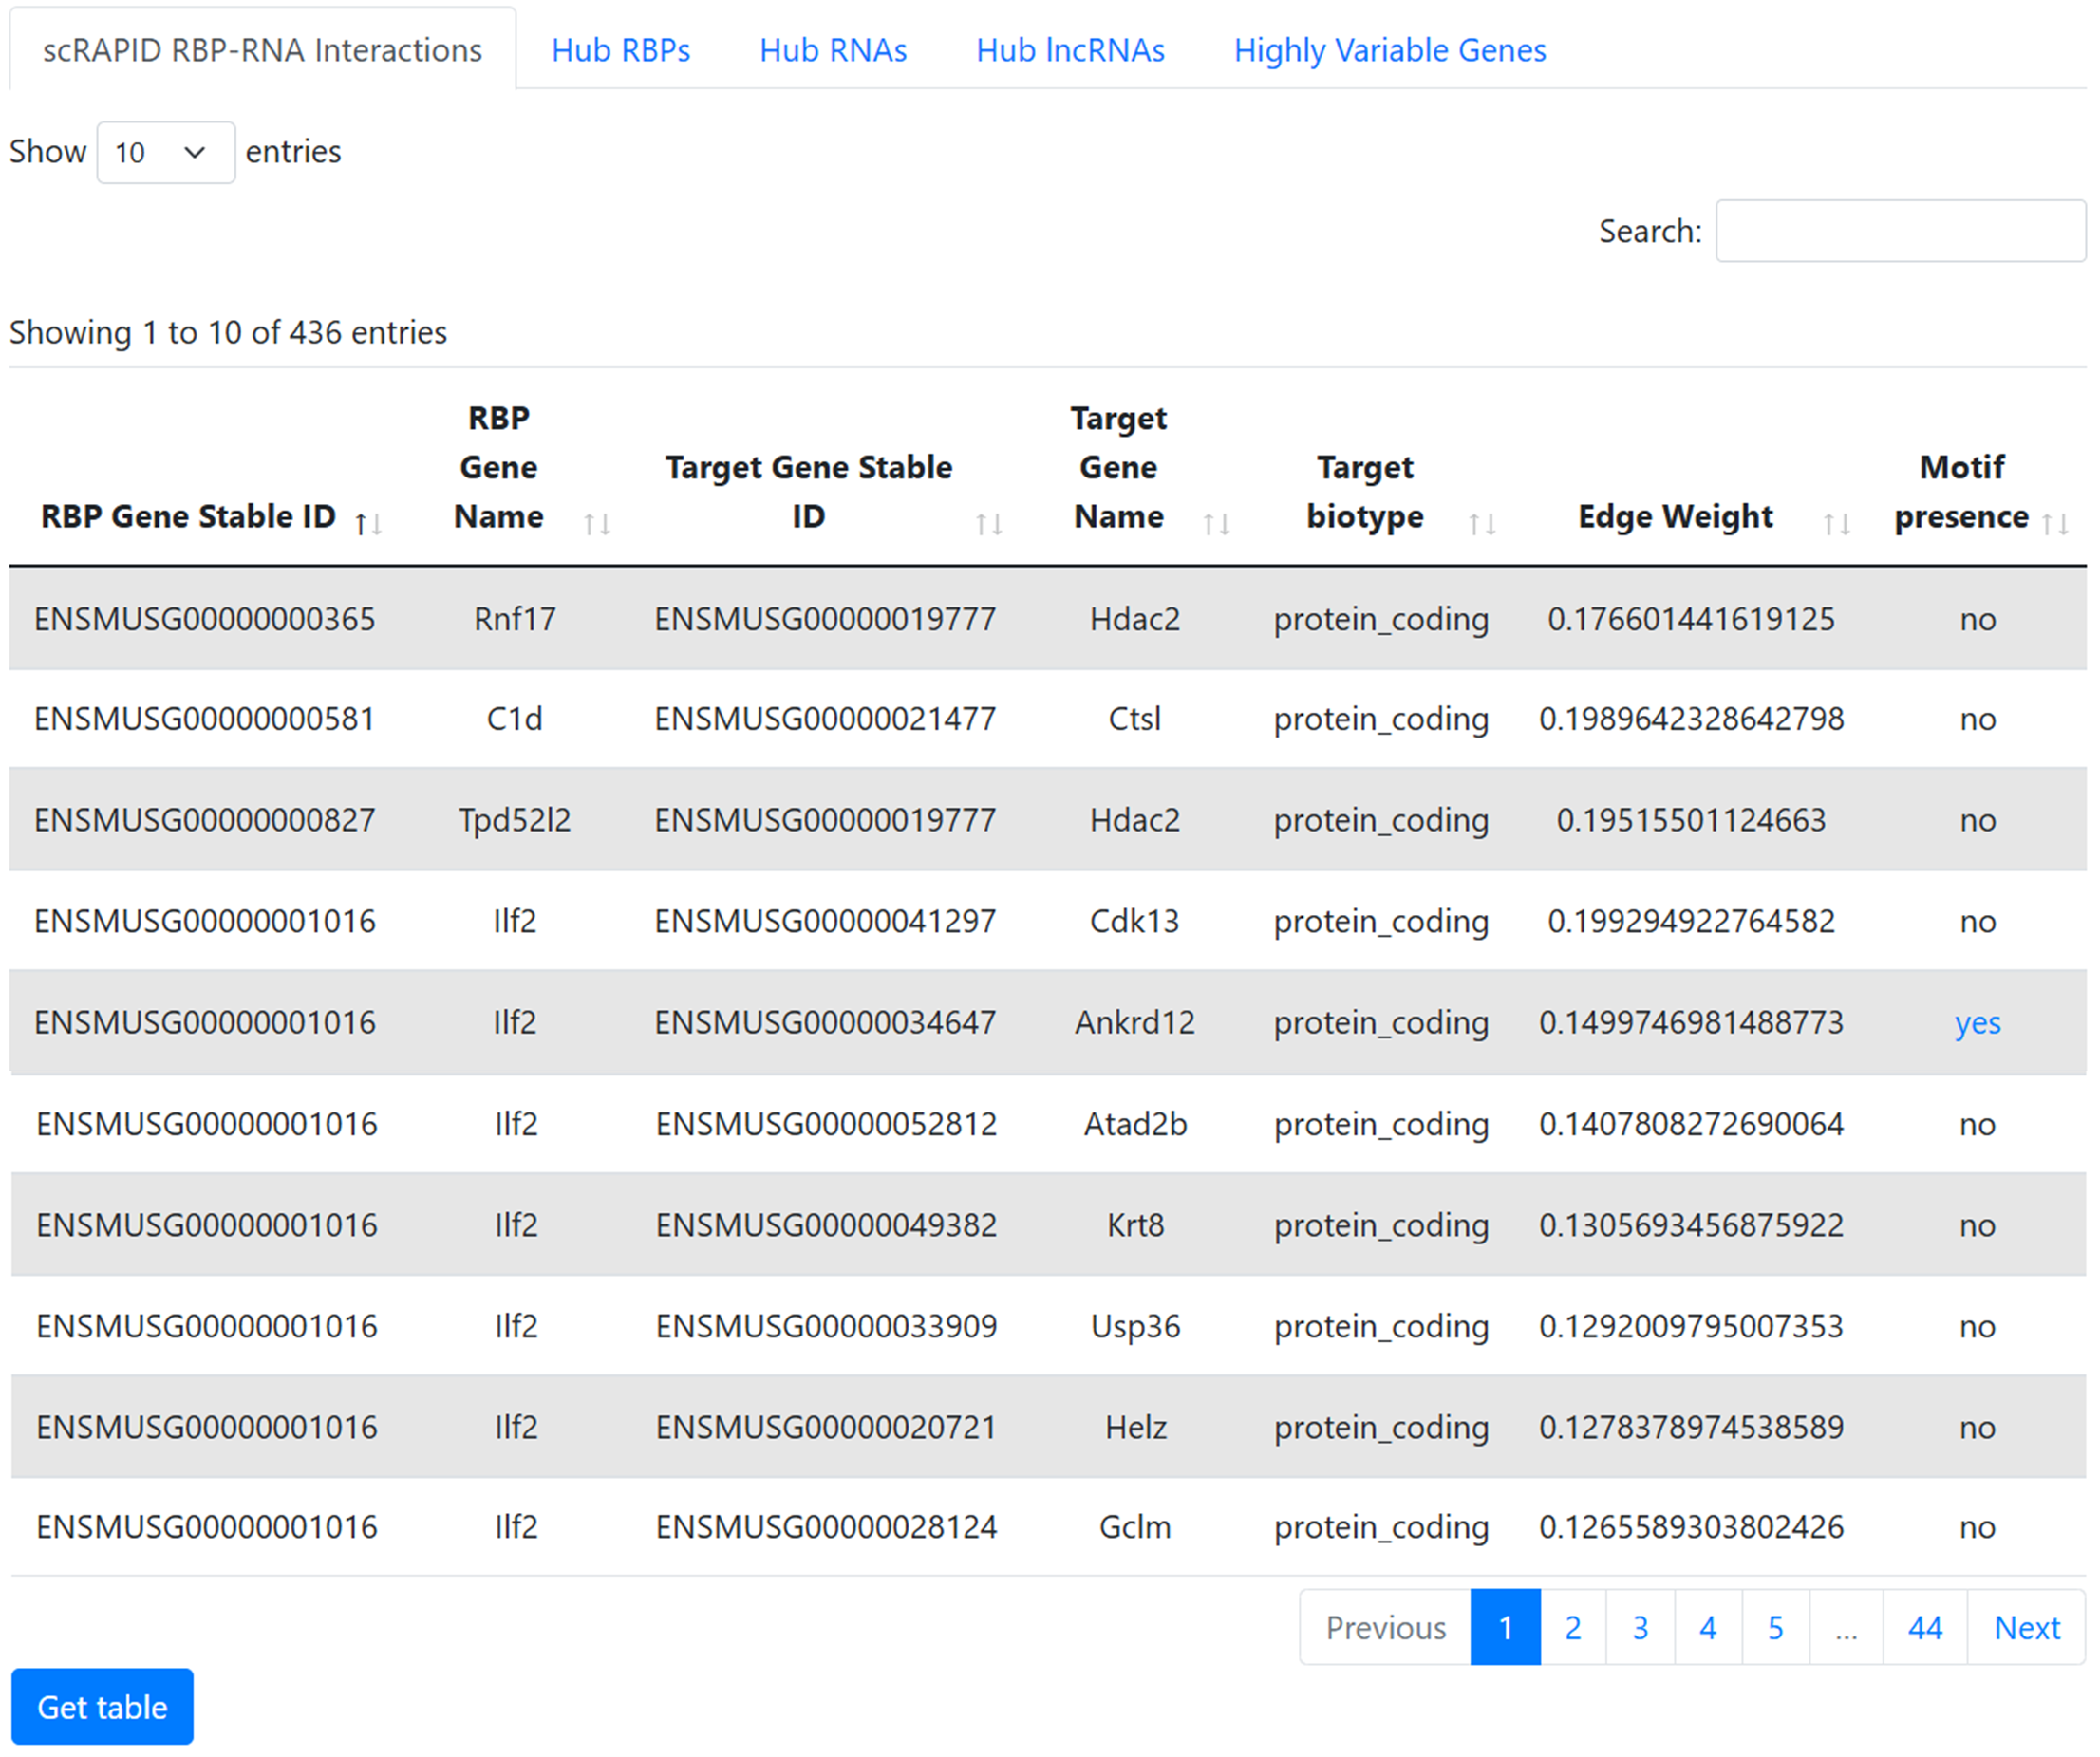
Below the network, a table menu allows access to several tables reporting the results of the scRAPID pipeline. Each table can be downloaded in CSV format by clicking on the “Get table” button below the table. To open the file in Excel, create a new blank workbook, navigate to the Data tab, and select Get External Data > From Text/CSV. Users can sort tables based on column values and search for specific genes.
scRAPID RBP-RNA Interactions
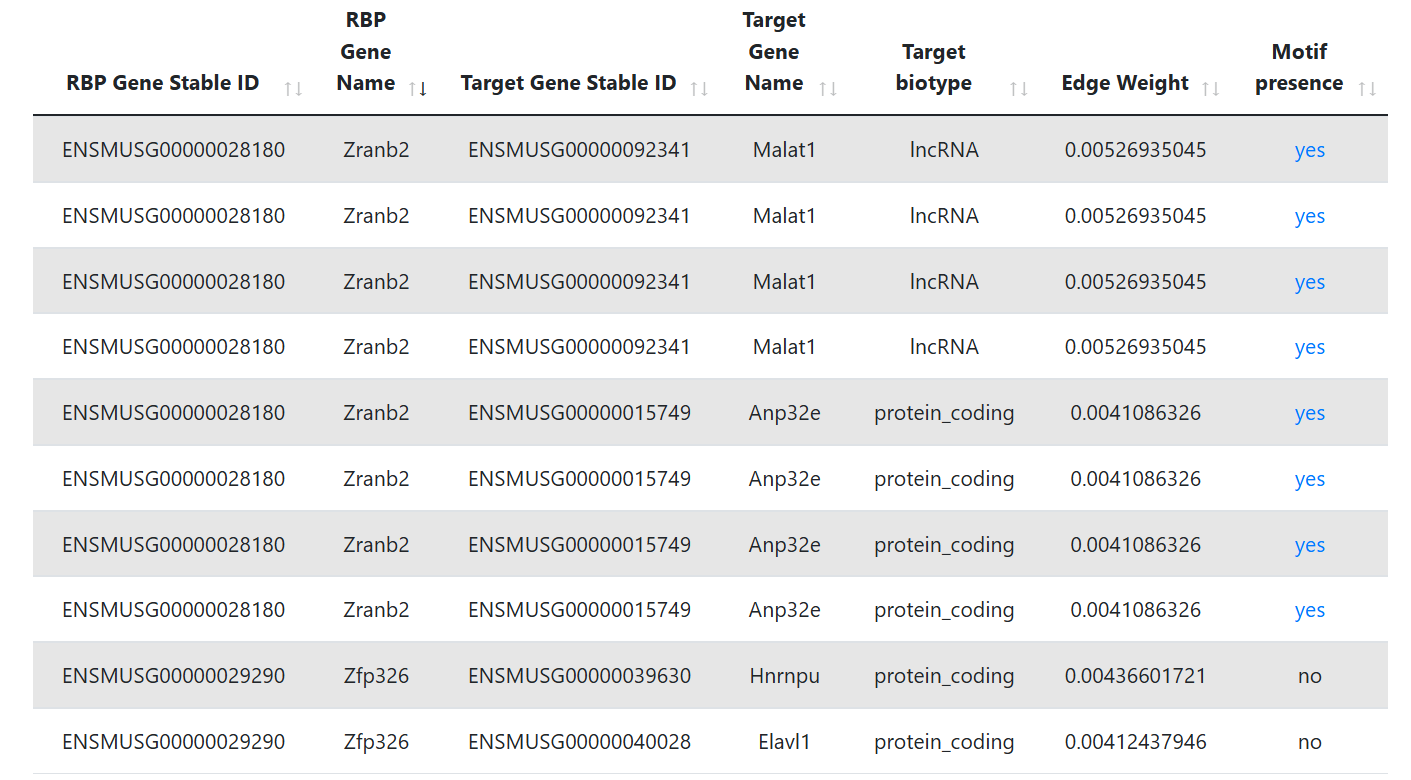
This table represents the list of inferred protein-RNA interactions that passed the catRAPID-based filter. The table can be downloaded in CSV format by clicking on the “Get table” button below the table or in JSON format by clicking "Ge Json Object" which can be imported in Cytoscape.
The first column displays the Ensembl gene ID of the RBP, while the second shows its gene symbol. The third and fourth columns provide the same information for the target. The fifth column shows the target Ensembl Transcript ID while the sixth indicates the biotype of the target. The seventh shows the edge weight (the score assigned to the interaction by the inference algorithm), and the last column indicates whether RBP-specific motifs were identified within the target sequences. By clicking on the “direct/assigned” values, it is possible to access information about the motif, including the position of its occurrences.
Motif details

Hub RBPs
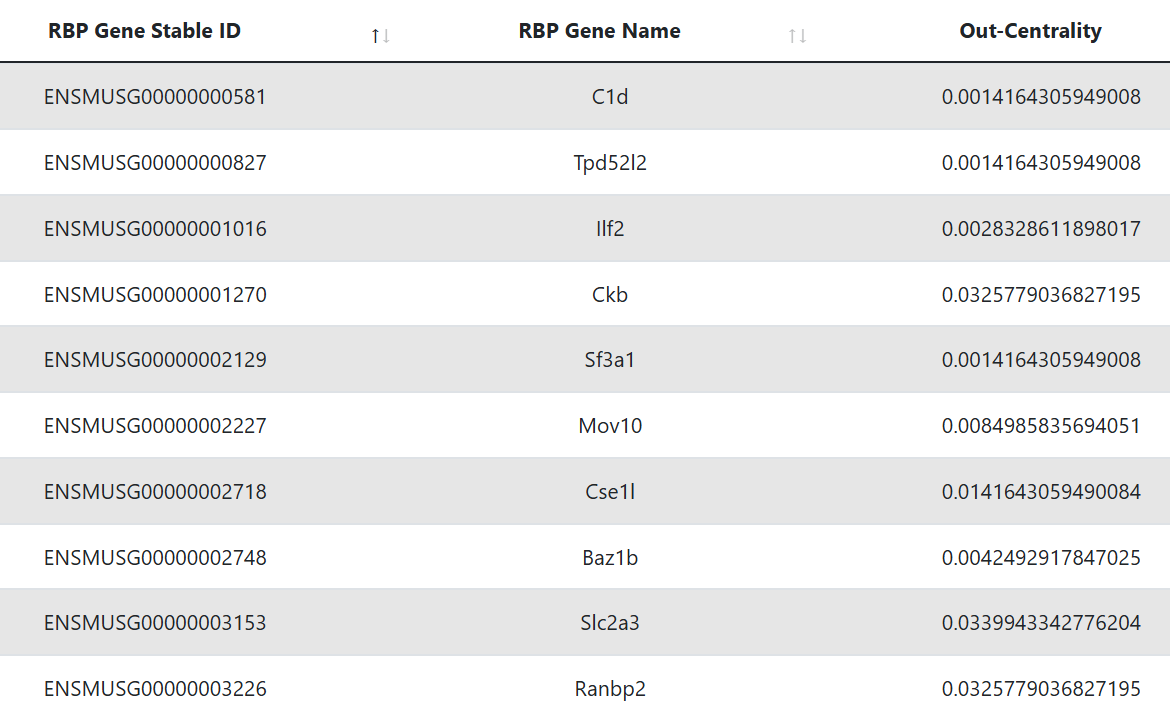
This table represents the RBPs that are identified as hubs. The first column displays the Ensembl gene ID of the RBP, while the second shows its gene symbol. The third column reports the out-degree centrality, which is the fraction of nodes its outgoing edges are connected to.
Hub RNAs
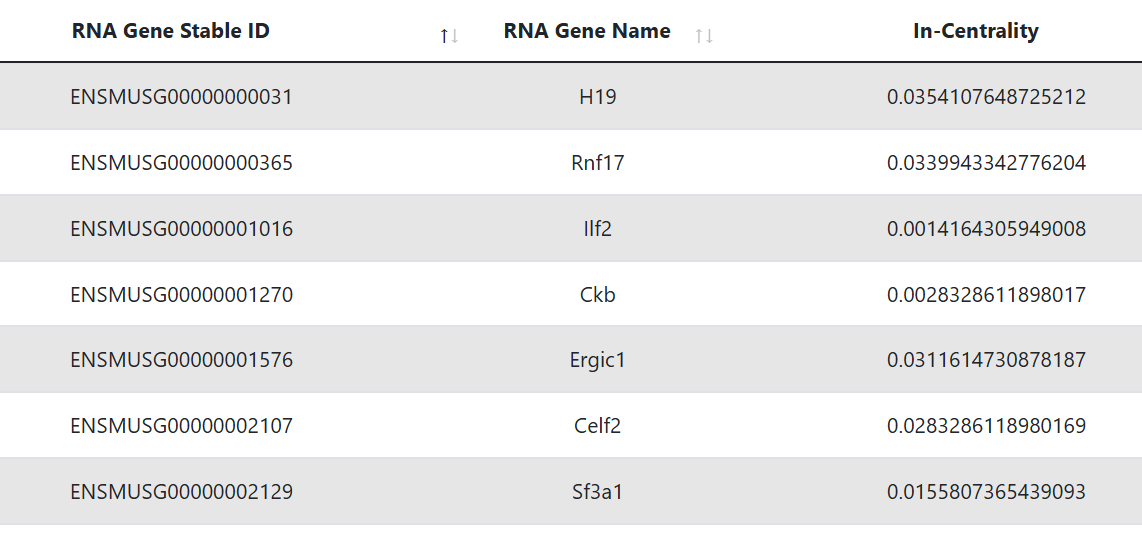
This table represents the targets that are identified as hubs. The first and second column display the Ensembl gene ID and Ensembl Transcript ID of the RNA, while the third shows its gene symbol. The last column reports the in-degree centrality, which is the fraction of nodes its incoming edges are connected to.
Hub lncRNAs
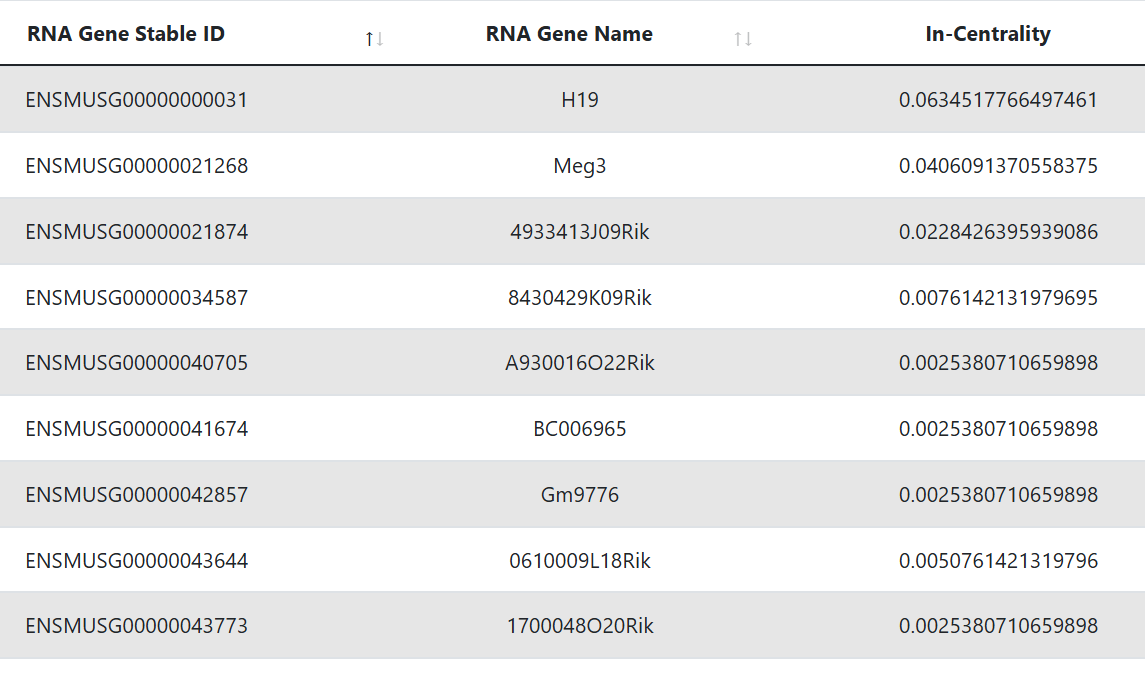
This table is shown only when the lncRNA biotype is selected. It represents the lncRNA targets that are identified as hubs. The first and second column display the Ensembl gene ID and Ensembl Transcript ID of the RNA, while the third shows its gene symbol. The third column reports the in-degree centrality, which is the fraction of nodes its incoming edges are connected to.
RBP Co-Interactions
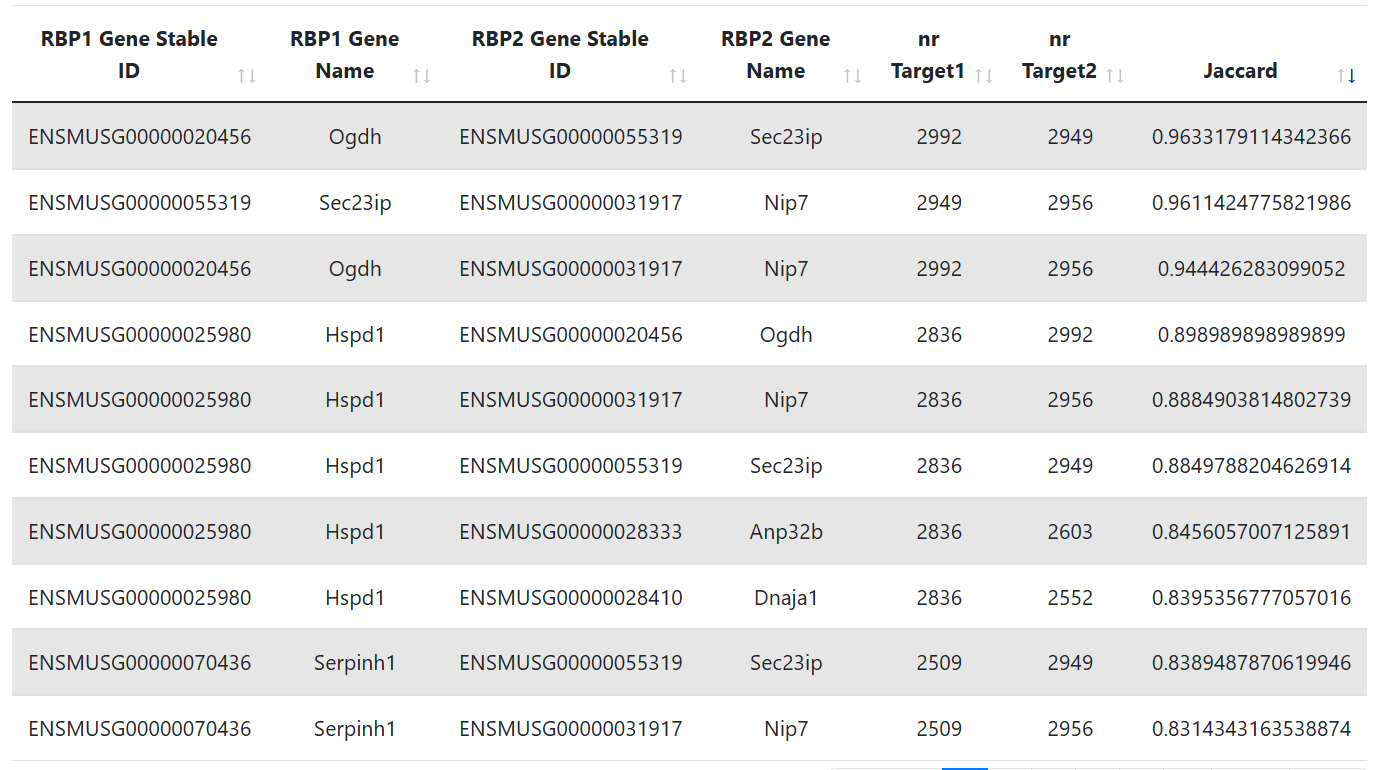
This table lists RBP-RBP pairs, along with the number of targets from the inferred GRN (see the Documentation for more details) and the Jaccard coefficient quantifying target overlap.
GRN Inference Genes
This table lists the Inference genes used for network inference. Depending on the user input, these genes are either the top variable genes (topHVGs) or the user provided list of genes combined with all the highly variable RBPs
