scRAPID-web Documentation
scRAPID-web implements the scRAPID pipeline to predict protein–RNA interactions from single-cell RNA-sequencing (scRNA-seq) data (Fiorentino et al. [Nucleic Acids Res. 2024]). scRAPID integrates gene regulatory network (GRN) inference algorithms with predictions from catRAPID (Bellucci et al. [Nat Methods. 2011]), a tool that predicts the interaction propensity of protein–RNA pairs based on their secondary structure and physicochemical properties. Beyond the prediction of binary protein–RNA interactions, scRAPID identifies hub RBPs and RNAs (Stock, Popp et al. [Bioinformatics 2024]), and RBP-RBP interactions.
How it works
The main input of scRAPID is a gene expression matrix obtained from single-cell or single-nucleus RNA-seq experiments, containing Unique Molecular Identifiers (UMIs) or read counts. Gene filtering, expression matrix normalization, mapping to Ensembl gene IDs, and user-setting-based selection of highly variable RBPs and genes—highly variable genes or a custom gene list uploaded by the user—are the first steps in the pipeline. GRN inference is performed on the expression data relative to the selected genes. The supported GRN inference algorithms are GRNBoost2, TENET, and DeepSEM. GRNBoost2 employs gradient-boosting regression models to uncover relationships between target genes and transcription factors, optimized for handling large datasets efficiently (Moerman et al. [Bioinformatics 2019]). TENET reconstructs GRNs from scRNA-seq data by ordering cells along pseudotime and using transfer entropy to identify directed causal relationships (Kim et al. [Nucleic Acids Res. 2021]). DeepSEM employs a neural network version of the Structural Equation Model (SEM) to reconstruct a GRN, embed and simulate scRNA-seq data (Shu et al. [ Nat Comput Sci 2021]).
After the selected GRN inference method is applied, the resulting network is filtered to include only directed RBP-target interactions. Indirect interactions are removed using catRAPID interaction propensities previously computed on precompiled RBP and RNA libraries. An important parameter of the scRAPID pipeline is the cutoff on the catRAPID interaction propensity, used after GRN inference to eliminate indirect protein–RNA interactions. We use a cutoff of 30, originally calibrated for mRNAs, lncRNAs and pseudogenes based on multiple scRNA-seq datasets and GRN inference algorithms (Fiorentino et al. [Nucleic Acids Res. 2024]), while we recalculated it for short non-coding RNAs, obtaining an optimal cutoff value of 8.
Hub RBPs, RNAs, and lncRNAs (if present) are identified as described in (Fiorentino et al. [Nucleic Acids Res. 2024], Stock, Popp et al. [Bioinformatics 2024]). RBP-RBP interactions are computed based on the target overlap of RBP pairs, quantified via the Jaccard coefficient.
Precompiled libraries
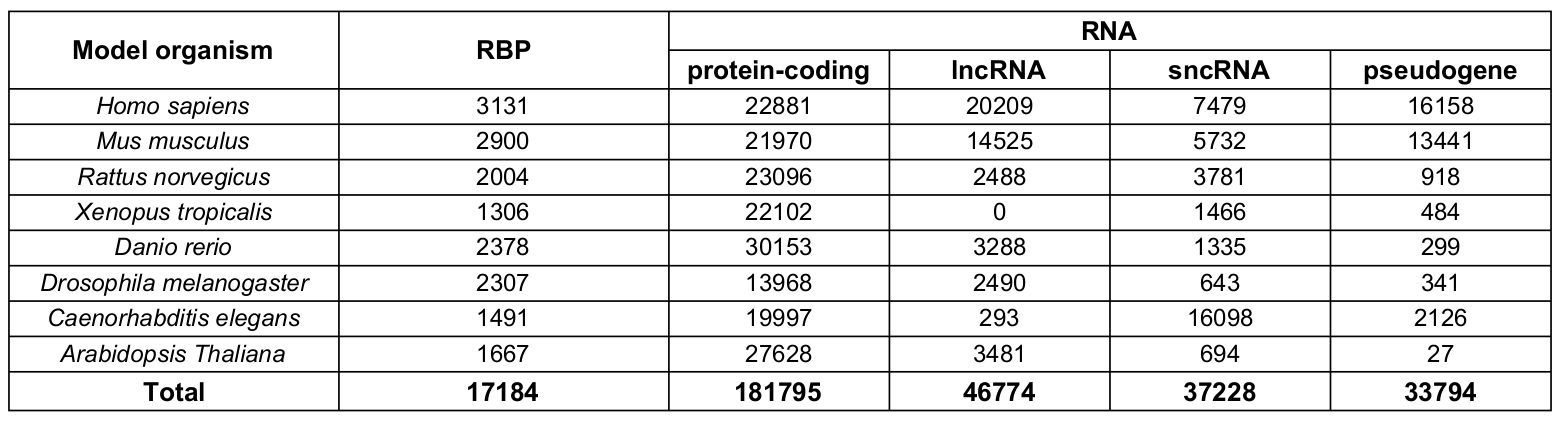
Human and mouse RBP libraries were obtained by expanding the RBP libraries from the catRAPID omics v2.0 web server (Armaos, Colantoni et al. [Nucleic Acids Res. 2021]) using orthology information and integrating them with proteins scoring ≥ 10 in the RBP2GO database (Armaos, Colantoni et al. [Nucleic Acids Res. 2021]). For Thaliana, Caenorhabditis Elegans, Danio Rerio, Drosophila Melanogaster the RBPs were taken directly from the catRAPID omics v2.0 libraries and supplemented with proteins with RBP2GO score >= 10. For Rattus norvegicus and Xenopus tropicalis, which are not covered by the RBP2GO database, protein sequences were retrieved from Uniprot (release 2024_03) (UniProt Consortium [Nucleic Acids Res. 2023]).
RNA libraries were obtained from Ensembl 107 (Cunningham et al. [Nucleic Acids Res. 2022]), except for those relative to Arabidopsis thaliana, gathered from Ensembl Plants 56 (Yates et al. [Nucleic Acids Res. 2022] et al. [Nat Methods. 2011]).
Transcripts were divided into 4 categories, based on the gene biotype:
- protein-coding: protein_coding
- long non-coding: lincRNA, lncRNA, antisense, antisense_RNA, sense_intronic, sense_overlapping, processed_transcript, TEC
- small non-coding: ribozyme, snRNA, sRNA, snoRNA, miRNA, pre-miRNA, scaRNA, misc_RNA, vault_RNA, scRNA, Y_RNA, piRNA
- pseudogene: pseudogene, polymorphic_pseudogene, processed_pseudogene, unprocessed_pseudogene, unitary_pseudogene, transcribed_processed_pseudogene, transcribed_unprocessed_pseudogene, transcribed_unitary_pseudogene, translated_processed_pseudogene, translated_unprocessed_pseudogene, translated_unitary_pseudogene, nontranslating_CDS
For Drosophila melanogaster, transcripts at least 200 nucleotides long, with the ncRNA gene biotype, and containing the term "lncRNA", "asRNA", "sisRNA", "Su(Ste)", "Uhg", "hpRNA", or "RNaseMRP" in the gene name were classified as long non-coding RNAs. All other ncRNAs were included in the small non-coding RNA library.
The Ensembl Gene ID and the Ensembl Transcript ID are used internally to indicate the transcripts. Only the Ensembl-annotated canonical isoform of a gene with several transcript isoforms was kept; if the gene was unannotated, the longest isoform was selected. We made sure the chosen transcript for genes having a protein-coding biotype had a protein-coding transcript biotype. The same database and criteria used in the catRAPID omics v2.0 web server were used to search transcript sequences for instances of RNA-binding motifs. If motifs from the most similar RBPs with at least 70% sequence identity were available, we used them for RNA-binding proteins without known motifs; MMseqs2 was used to find similar sequences (Steinegger et al. [Nat Biotechnol. 2017]).
To compute catRAPID interaction propensities of protein–RNA pairs, we employed the fragmentation-based method used by the RNact database (Lang et al. [Nucleic Acids Res. 2019]), the catRAPID omics v2.0 web server (Armaos, Colantoni et al. [Nucleic Acids Res. 2021]), and the "catRAPID fragments" module (Cirillo et al. [RNA. 2013]). The interaction propensity for a protein–RNA pair is determined by taking the largest value from the distribution of interaction propensities of their fragments, as in RNAct and the scRAPID internal database. For each organism, we created a SQL database of protein–RNA interaction propensities using the sqlite3 Python package. This database is fastly queried in the catRAPID-based filtering step of the scRAPID pipeline's interactions.
Output interpretation
The following downloadable, searchable, and sortable tables are displayed in the output page:
- scRAPID RBP-RNA interactions: list of inferred protein–RNA interactions that passed the catRAPID-based filter, including target RNA biotype, edge weights returned by the selected GRN inference method and RBP-specific motifs identified within the target sequences. This table can be downloaded as a table (in .csv format) or as a Cytoscape-compatible JSON file;
- Hub RBPs: list of RBPs and their out-centrality values (fraction of outgoing edges in the GRN);
- Hub RNAs: list of target RNAs and their in-centrality values.
- Hub lncRNAs: list of target lncRNAs, if present in the dataset, including in-centrality values (fraction of ingoing edges in the GRN).
- RBP Co-interactions: list of RBP–RBP pairs including the number of target RNAs of both RBPs from the inferred GRN and the Jaccard coefficient quantifying target overlap. For GRN inference methods that return more than 5% of the possible edges, the ranking is trimmed to retain only the top 5% edges, otherwise all edges are kept. Then, for each pair of RBPs, the Jaccard coefficient between their sets of targets is computed. The RBP–RBP interaction analysis is not performed if TENET is selected due to its poor performance in this task.
- GRN Inference Genes: list of the genes which are used to infer the GRN. This list is generated by combining all the highly variable RBPs with either the top highly variable genes selected by the user or the custom gene list provided by the user.
At the bottom of the output page, an interactive RBP–RBP interaction network is displayed, where nodes represent RBPs and edges indicate interactions with Jaccard coefficient exceeding a user-defined threshold. Users can adjust the threshold dynamically using a slider, which automatically updates the network layout in real time. The network can be downloaded as a Cytoscape-compatible JSON file or png file.
Performances
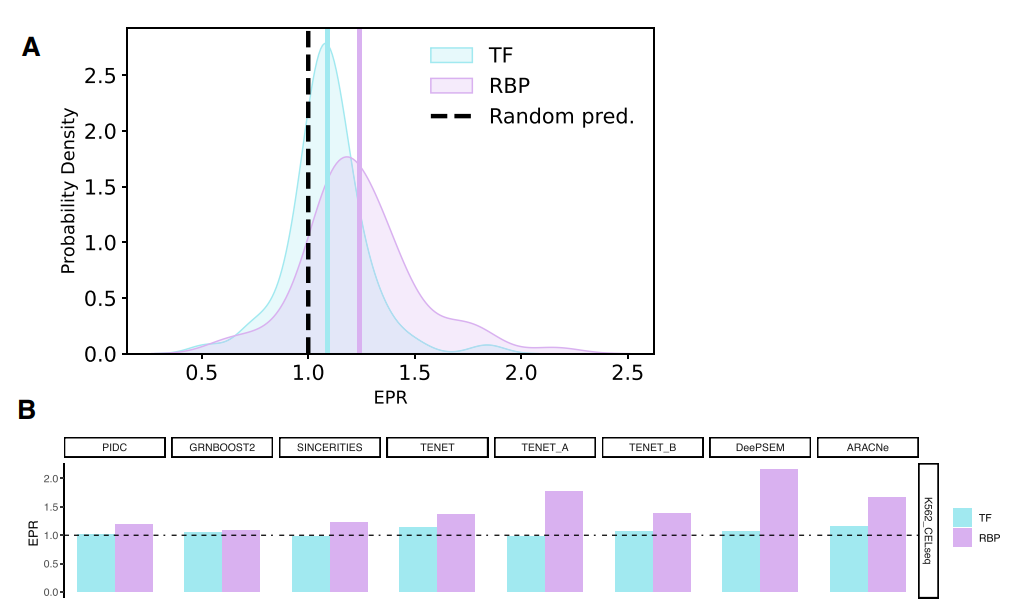
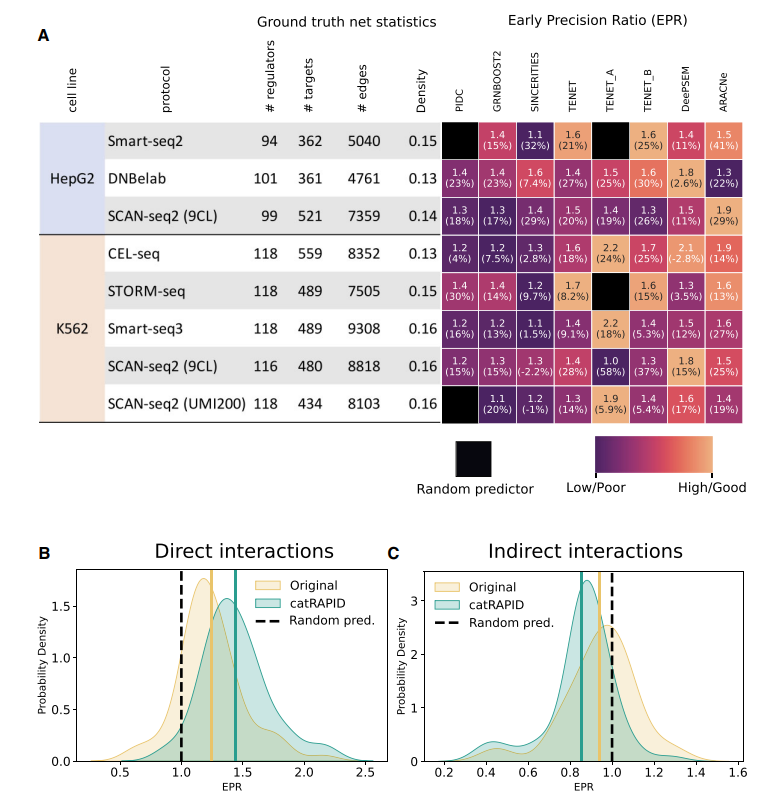
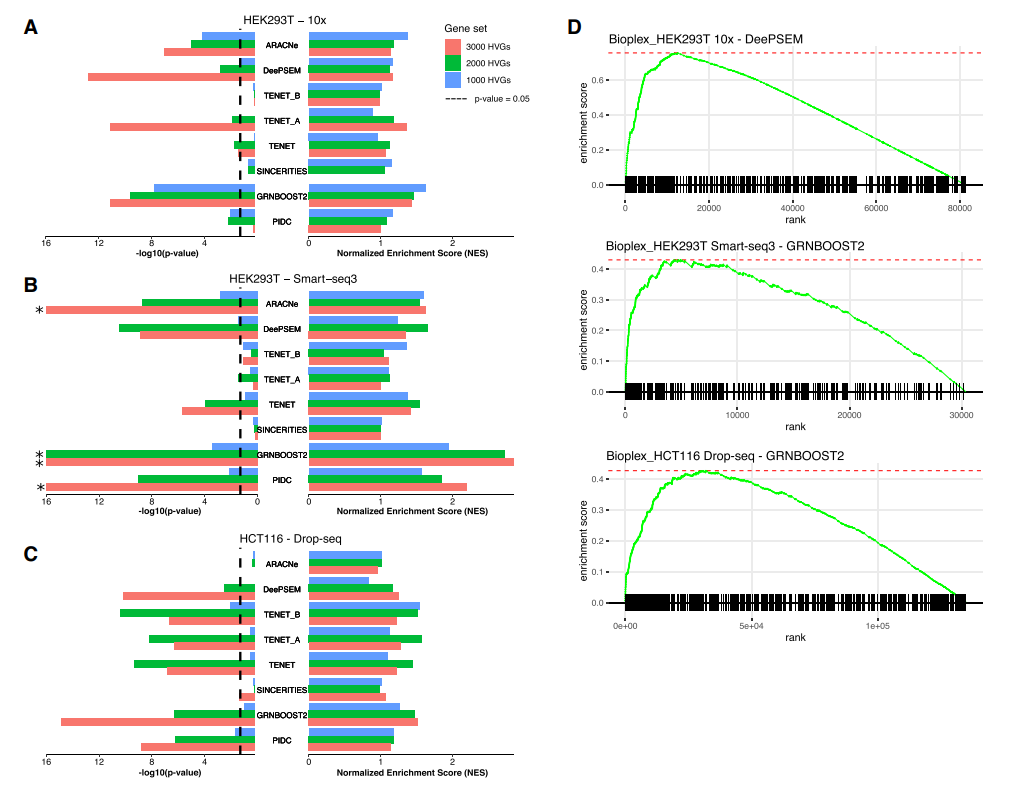
The performance of scRAPID in predicting protein-RNA interactions from single-cell transcriptomic data has been systematically evaluated across various datasets and methods (Fiorentino et al. [Nucleic Acids Res. 2024]). The prediction of RBP-target interactions consistently achieves higher Early Precision Ratio (EPR) compared to the inference of transcription factor-target interactions, the standard task in GRN inference from scRNA-seq data, with DeepSEM and TENET showing the best performance.
The integration with catRAPID predictions (Bellucci et al. [Nat Methods. 2011]) significantly improves the ability to predict interactions, particularly for long non-coding RNAs (lncRNAs). In particular, the application of catRAPID filtering led to an average relative improvement in EPR of 17.6% across datasets and methods, indicating its effectiveness in refining the inferred networks by eliminating indirect interactions.
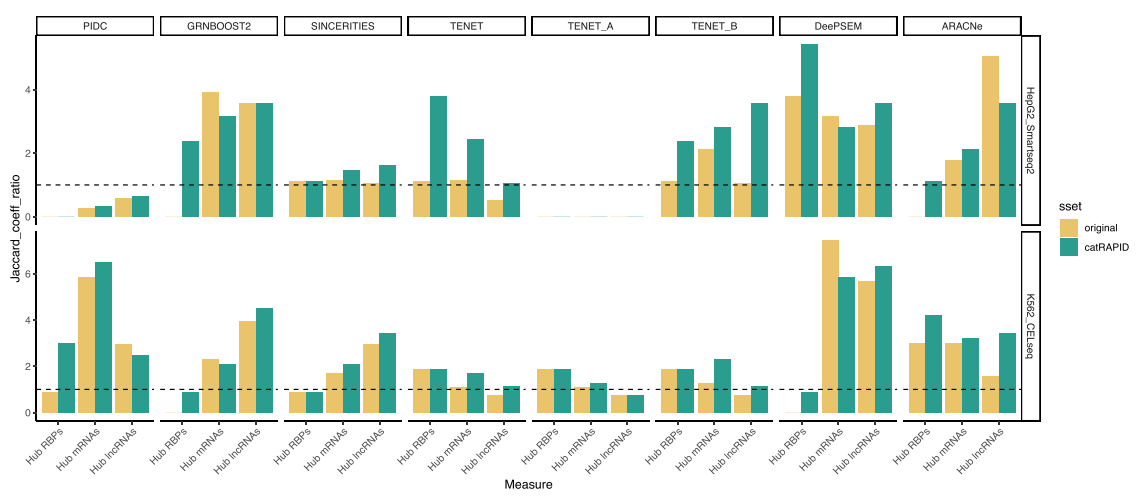
Additionally, scRAPID identifies hub RBPs and hub RNAs, with the catRAPID filter preserving or increasing the Jaccard coefficient ratio (JCR) in 95% of cases for datasets with 500 highly variable genes (HVGs).
Finally, scRAPID predicts direct RBP–RBP interactions by leveraging the overlap of RNA targets inferred from the scRNA-seq data.
The scRAPID pipeline can be used with any GRN inference algorithm, making it a valuable tool for exploring complex protein-RNA regulatory networks in single-cell transcriptomic studies.
Reliability and error handling
scRAPID-web implements an automatic retry mechanism to ensure reliable task execution. If a task encounters an error during processing, the system will automatically retry the task up to 3 times with a 60-second delay between attempts. This helps handle transient errors such as temporary resource unavailability or network issues. Users will be notified via email if the task ultimately fails after all retry attempts are exhausted.
Execution times and output robustness
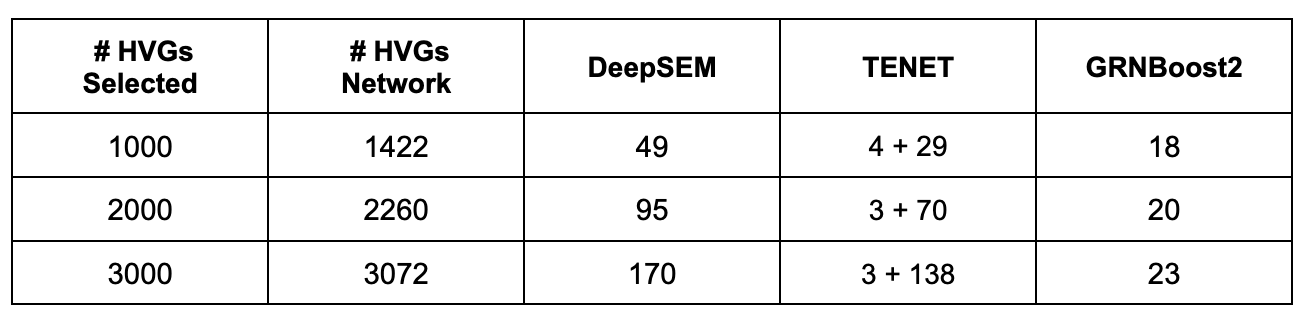
The execution times vary based on the algorithm, the organism, and the number of genes used for network inference. The table below summarizes the time required for each GRN inference algorithm to complete a run starting from:
- A matrix with 2448 cells from a retinoic acid-driven differentiation time course of mouse embryonic stem cells (Semrau et al. [Nat Commun. 2017)
- A matrix with 11206 cells from an in vitro differentiation of Pharyngeal Endoderm cells from human embryonic stem cells (Cipriano, Colantoni et al. [Genome Biology 2024])
“# HVGs Network” refers to the genes used for network inference, which is the union of the selected HVGs (or the genes in the user-submitted list) with all the highly variable RBPs, reported in the GRN Inference Genes output table. For the TENET algorithm, the table reports the time required for the generation of the diffusion map + the time required for the subsequent analysis.
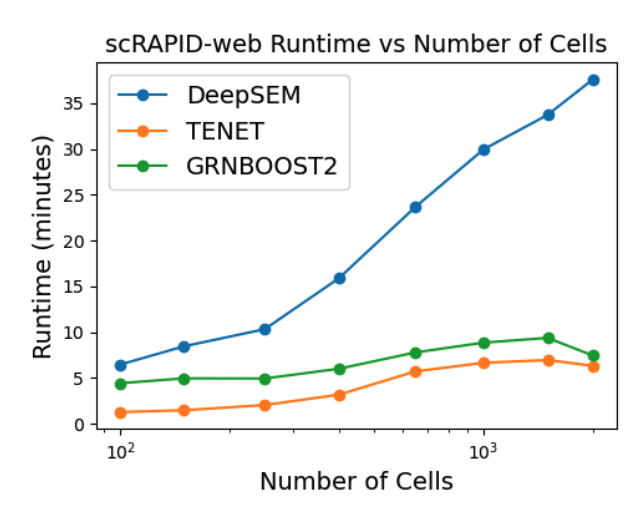
We evaluated the runtime performance of the three GRN inference algorithms as a function of the number of cells, using a fixed set of 1,000 highly variable genes. As shown in the line plot below, the runtimes of TENET and GRNBoost2 remain approximately constant as the number of cells increases, whereas DeepSEM exhibits an almost linear scaling. Importantly, when these results are compared with the execution times reported in the summary table, it becomes clear that the primary computational bottleneck in GRN inference is the number of genes rather than the number of cells.
To assess the reproducibility of the results, we performed three independent runs for each GRN inference algorithm using 1,000 highly variable genes from the example mouse dataset. For each algorithm, we evaluated the consistency of the main outputs by computing the average Spearman correlation coefficient between runs for the following rankings:
- RBP–RNA interactions
- Hub RBPs
- Hub RNAs
- RBP co-interactions (not available for TENET)
The results show that TENET is fully deterministic, yielding identical outputs across runs (correlation = 1 for all applicable rankings). DeepSEM demonstrates very high reproducibility, with correlation values close to 1 for all rankings, and a slightly lower yet still high correlation (0.88) for RBP co-interactions. GRNBoost2 exhibits moderately lower correlations, particularly for RBP–RNA interactions and RBP co-interactions (≈0.7), but overall maintains robust reproducibility of the key outputs.
| Ranking type | GRNBoost2 | TENET | DeepSEM |
|---|---|---|---|
| RBP-RNA | 0.67 | 1 | 0.96 |
| Hub RBPs | 0.96 | 1 | 0.97 |
| Hub RNAs | 0.91 | 1 | 0.98 |
| RBP co-interactions | 0.66 | X | 0.88 |
Reproducibility of the rankings produced by three different scRAPID runs across four different tasks, measured using the average Spearman correlation coefficient.
Job Submission, Monitoring, and Troubleshooting
Job submission and execution
After uploading a gene expression matrix and selecting the analysis parameters, scRAPID-web submits the job to a backend queue for execution. Depending on the selected GRN inference algorithm, the number of genes used for network inference, and server load, execution times may range from a few minutes to several hours (see Execution times). Once submitted, jobs are processed asynchronously and do not require the user to keep the browser session active.
Job status and progress tracking
Each submitted job is associated with a dedicated results page that provides real-time status updates. The execution log is updated throughout the pipeline and reports the completion of all major steps, including data preprocessing, GRN inference, catRAPID-based filtering, hub identification, and final result generation. Upon successful completion, all output files become available for download directly from the results page.
Failure handling and automatic retries
To improve robustness against transient failures (e.g., temporary resource unavailability or brief system overload), scRAPID-web implements an automated retry mechanism. Failed tasks are automatically retried up to three times, with a short delay between attempts, before being marked as unsuccessful. This mechanism reduces the need for manual resubmission and increases the likelihood of successful job completion in the presence of temporary backend issues.
Troubleshooting and post-failure recovery
If a job ultimately fails, the results page reports detailed error messages describing the point of failure. Common causes include incompatible input formats, excessive numbers of highly variable genes, or datasets exceeding the maximum supported file size (50 MB compressed). In such cases, users are advised to reduce the number of genes selected for GRN inference, try an alternative GRN inference algorithm, or run scRAPID locally using the publicly available implementation and SQL databases provided via GitHub (https://github.com/tartaglialabIIT/scRAPID.git) and Zenodo (https://doi.org/10.5281/zenodo.10210488).
Data Privacy and Security
The web server is designed to ensure the privacy and security of user data. Uploaded datasets are not stored persistently: all data are kept in memory for the duration of the analysis and are automatically deleted as soon as the session ends. Communication between the user and the server is fully encrypted via HTTPS/TLS.
Each analysis is executed in an isolated compute environment, preventing any interaction or data leakage between concurrent user sessions. Uploaded data are never shared with third parties and are not used for model training or any purpose beyond the requested analysis.
The server does not require any personal information. Users are encouraged to remove potentially identifying metadata (e.g., sample names) before upload. Server logs are limited to minimal technical information, such as job timestamps or error messages, and do not contain biological or user-provided data.