RIME Web Server Documentation
RIME (RNA Interactions Model with Embeddings) is a deep learning model that predicts RRIs by leveraging embeddings from the Nucleotide Transformer language model. The model was trained to infer whether two input RNA sequences, modeled using a contact matrix representation, interact (positive class) or not (negative class). To ensure the identification of direct RNA-RNA interactions, independent of protein mediation, the positive set consisted of contact matrix windows encompassing duplexes (PP, Paired regions in interacting transcript Pairs) detected by Psoralen-based high-throughput RRI detection methodologies (PARIS, PARIS2 and SPLASH). The negative set was constructed from three distinct classes of non-interacting. These included randomly selected Non-paired regions in interacting transcript Pairs (NP), randomly selected Non-paired regions in Non-interacting transcript pairs (NN), and Paired regions already seen in the positive set combined in Non-interacting transcript pairs (PN). This setup allowed us to approach RRI prediction from two angles:
- Discriminating RNA-RNA Patches (DRP) focuses on distinguishing interacting regions (PP) from non-interacting ones (NN, NP).
- Discriminating RNA-RNA Interactors (DRI) involves identifying interacting regions within transcript pairs that are truly interacting (PP) versus those in randomly combined transcript pairs that are not interacting with each other (PN)
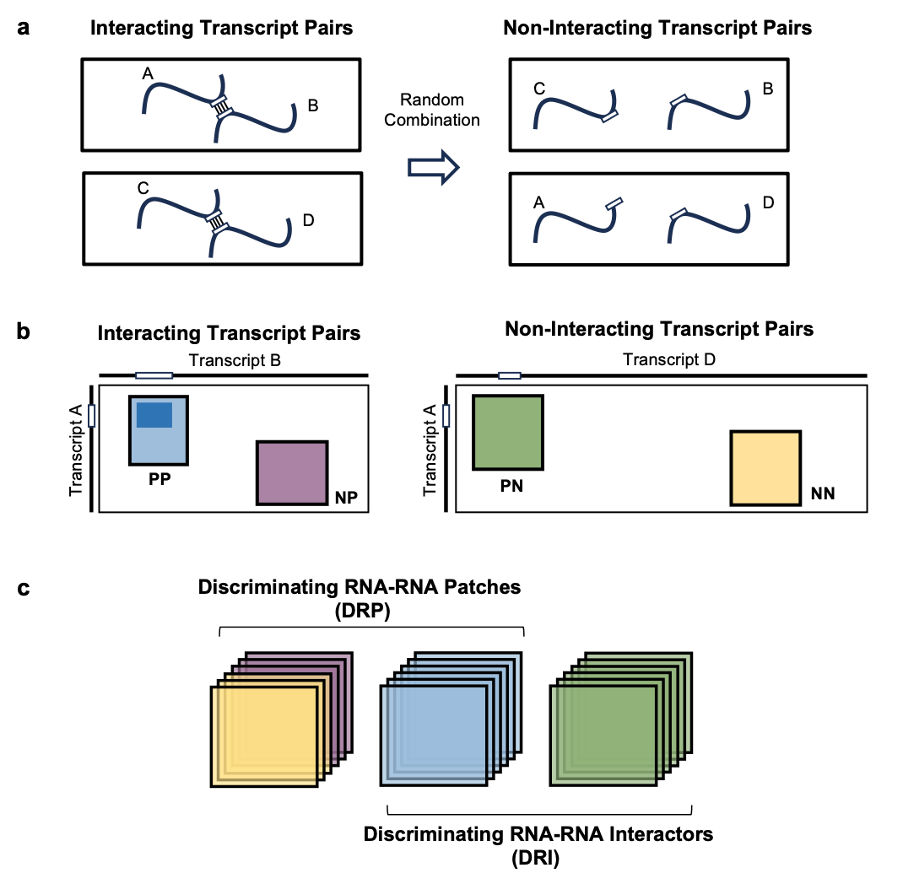
Figure 1: Preparation of datasets for training and evaluation of RIME. a, Schematic representation of the negative data generation process. Non-interacting pairs were generated by randomly combining interacting transcript pairs. The interacting sites are shown as white rectangles along transcript sequences, represented with lines. b, Illustration of Interacting Transcript Pairs (left panel) and Non-interacting Transcript Pairs (right panel), represented with contact matrices. Training and evaluation data were generated by sampling windows of varying sizes within these matrices, classified into four categories (PP, NP, NN, or PN) based on their positions. Interacting sites, depicted as white rectangles along the transcript sequence axes, are included in PP and PN windows but excluded from NN and NP windows. c, Visual representation of the DRP and DRI model evaluation tasks. In both cases, PPs serve as the positive set, while non-interacting regions (NN and NP) are used as the negative set for DRP, and randomly permuted interacting regions (PN) for DRI.
The extensive RRI set we compiled allowed us to perform a thorough evaluation of RIME performances, and to benchmark it against the most well-known thermodynamics-based prediction tools: IntaRNA 2, ASSA, RNAplex, RNAhybrid, RIsearch2, pRIblast, RNAup, and RNAcofold. To evaluate performance across different tools and account for errors in both positive and negative predictions, we used the Area Under the ROC Curve (AUC) as a global evaluation metric. The tools were tested on 200 nucleotide-long RNA regions pairs.
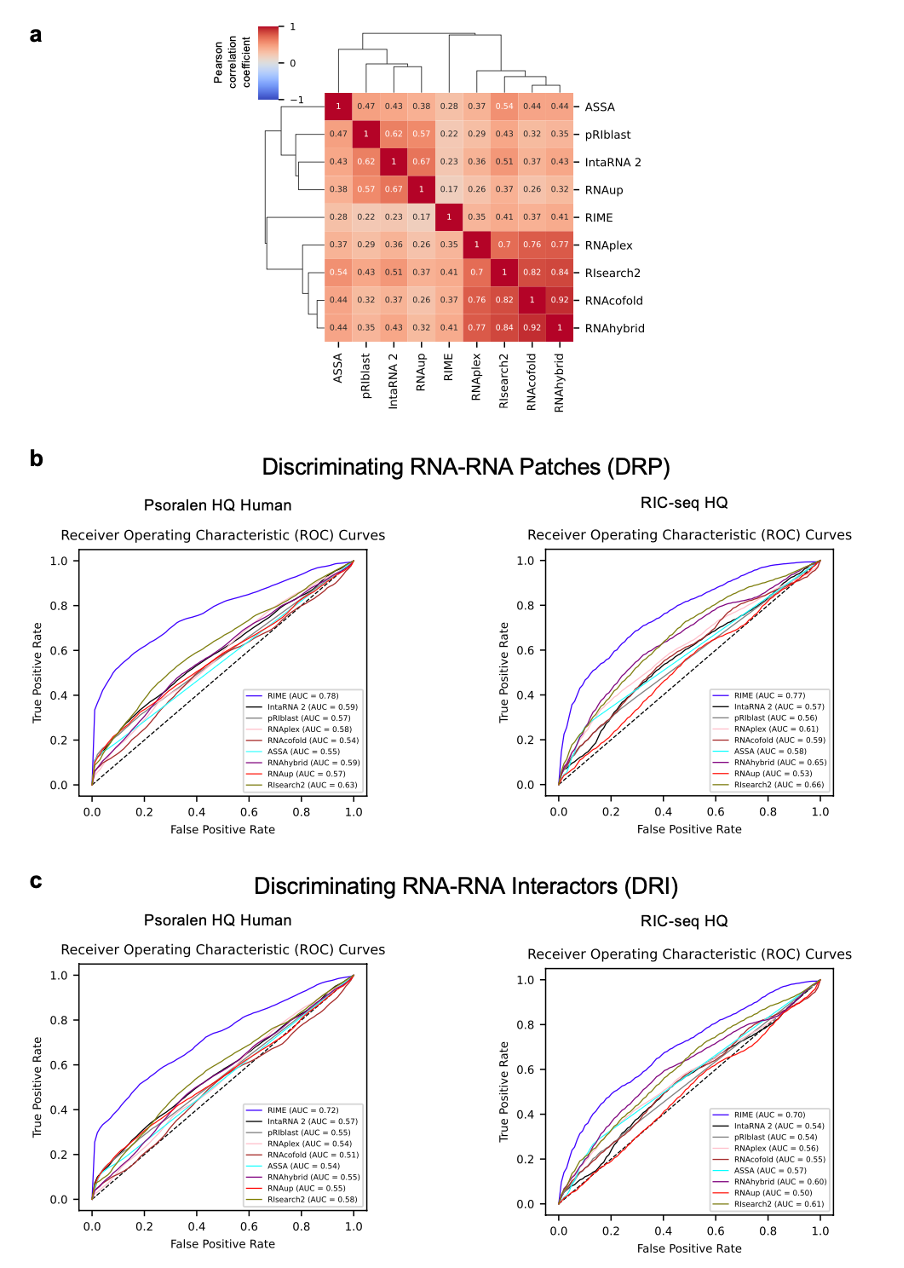
Figure 2: RIME overcomes the limitations of thermodynamics-based tools. a, Heatmap of Pearson correlation coefficients between RRI prediction tools, calculated using scores assigned to positive interactions in the Psoralen-based test set. For comparability with RIME scores, ∆G values from thermodynamics-based tools were converted by inverting their sign. Tools with similar scoring patterns were grouped using average linkage hierarchical clustering based on Euclidean distances. b and c, ROC curves describing the performances of the RRI prediction tools on the DRP (b) and DRI (c) tasks, shown for the Psoralen HQ Human (left), Psoralen HQ Mouse (middle), and RIC-seq HQ (right) datasets. To address class imbalance, negatives were randomly undersampled 100 times to match the number of positives, and ROC curves were averaged across iterations. b and c, ROC curves describing the performances of the RRI prediction tools in the DRP (b) and DRI (c) tasks, shown for the Psoralen HQ Human (left) and the RIC-seq HQ (right) datasets. To address class imbalance, negatives were randomly undersampled 100 times to match the number of positives, and ROC curves were averaged across iterations.
On the DRP task, RIME consistently outperformed all the other tools on human and murine Psoralen-based RNA–RNA interactions, especially when assessed against higher quality sets. In particular, for the human and murine subsets with at least 4 supporting reads or interacting regions length ≥ 35 nucleotides (hereby named Psoralen HQ Human and Psoralen HQ Mouse), RIME demonstrated an AUC of 0.74 and 0.83, respectively, while the top-performing thermodynamics-based tool (RIsearch2) reached 0.62 and 0.77, and SPOT-RNAc achieved 0.6 and 0.53. Noteworthy, we observed a similar trend for the RIC-Seq dataset, with RIME achieving an AUC of 0.77 when evaluated against interactions supported by at least 4 reads. In comparison, SPOT-RNAc, achieved an AUC of 0.70 on the same dataset, while thermodynamics-based tools reached a maximum AUC of 0.66 with RIsearch2. Although the overall performance metrics for the DRI task were comparatively lower, RIME still stood out as the top-performing tool, with its AUC improving alongside dataset quality. On the Psoralen HQ Human and Mouse datasets RIME demonstrated an AUC of 0.68 and 0.72, respectively, while the leading thermodynamics-based tool (RIsearch2) achieved an AUC of 0.58 and 0.70, and SPOT-RNAc achieved 0.59 and 0.53. Consistently, on the RIC-seq HQ dataset, RIME’s AUC (0.7) was significantly better than RIsearch2’s one (0.61) and slightly better than SPOT-RNAc’s one (0.69) which showed the best performance when evaluated on the full set.”
The web-server leverages the RIMEfull model, which was trained on an expanded dataset by incorporating the validation set into the training phase. This expanded training dataset enhanced the model's performance when evaluated on the high-quality RIC-seq data.
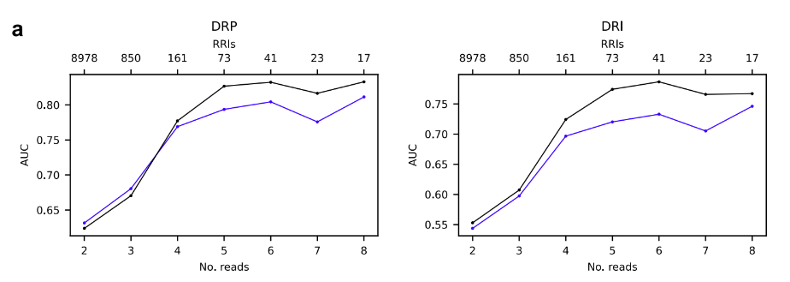
Figure 3: Evaluation of the RIMEfull model. Line plots illustrating the performance (ROC-AUC) of RIME and RIMEfull.